
Key takeaways
- Install GA4 and Search Console, then mark the one or two actions that matter most as key events.
- Use a GA4 funnel exploration to find the step where most visitors leave. It is often not the checkout.
- Use heatmaps and session recordings to see why, then turn what you find into a hypothesis you can test.
You use data to fix a leaking website in three steps. Install Google Analytics 4 and mark the one or two actions that matter as key events. Then find where visitors drop out, and watch what they do there. The tools are free, and you do not need to be a data scientist. You need to be a detective.
Start with a simple question: do you know if your website is working? Running a site without analytics is like running a shop and never checking the till. Plenty of businesses do exactly that, and end up with a beautiful, expensive and very leaky bucket.
Without analytics and conversion tracking, you cannot see who visits, where they come from or what they do. You can’t improve what you don’t measure.
When I audit a site and have access, Google Search Console and GA4 are my best tools. Everything below uses those two, plus one free heatmap tool. It is time to stop guessing and start growing.
The High Cost of Flying Blind
A website without analytics is a plane flying blind. You are moving, but you cannot see your altitude, speed or direction. You are missing four things.
- Visitor insights: who your audience is, what problems they bring and what devices they use.
- Traffic sources: whether SEO, social media or paid ads bring real visitors or empty clicks.
- User behavior: which pages people use and which dead ends drive them away.
- Content performance: whether your writing gets read or gathers dust.
Flying blind wastes money. Owners see weak sales and buy more traffic, pouring more water into a bucket that still leaks.
The Solution: A Mechanic’s Guide to Fixing the Leaks
You do not need to become a data scientist. Think of yourself as a mechanic with a diagnostic kit. Three steps take you from blind to useful.
Step 1: Install Your Dashboard (Google Analytics 4)
Google Analytics 4 is free, and it is where most businesses should start. GA4 is built on events. In Google’s words, GA4 data “is event-based, with the principle that any interaction can be captured as an event” (Google Analytics Help). A page view, a click, a video play and a purchase are each an event. That gives you a far more flexible view of the customer journey.
Setup is simple. Create an account and a web data stream, copy the measurement ID (it starts with “G-“) and add the tag to your site. Google’s setup guide notes: “Many CMSs have native integrations with Google Analytics.” On those platforms you paste the ID into a field, with no coding.
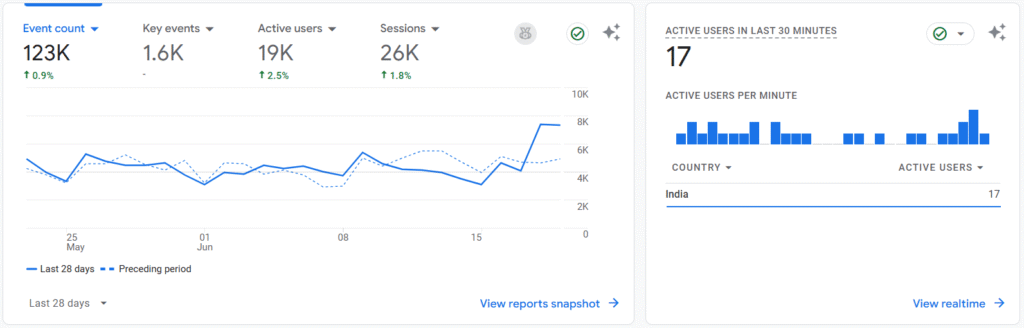
Set up Search Console at the same time. GA4 shows what people do on your site. Search Console’s Performance report shows how you appear in Google Search: clicks, impressions, click-through rate and average position, by query, page, country and device.
Step 2: Define Your Destination (Key Events)
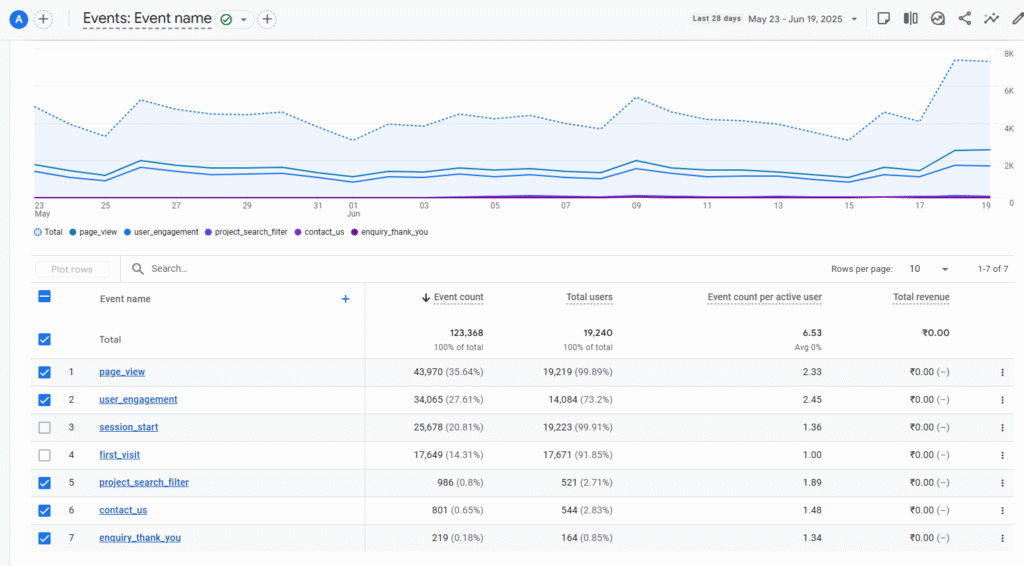
Analytics tells you what happened. Conversion tracking tells you whether it mattered. In GA4, the actions that count are called key events. Google defines one as “an event that measures an action that’s particularly important to the success of your business.” Pick one or two, not twenty.
Start with your business goal, then choose the event that proves it:
- Service business:
generate_lead, which Google’s recommended events list describes as when a user “submits a form or a request for information”. Orform_submit, which GA4’s enhanced measurement records “when the user submits a form”. - Online store:
purchase. - Consultant or author:
file_downloadfor a guide, or a newsletter sign-up.
Then, in GA4, go to Admin, then Events, and click the star next to the event to mark it as a key event. Now you can see which sources, campaigns and pages produce results, not just visits.
Step 3: Become a Data Detective
Data rewards curiosity. In my book Decoding The Click, I compare this step to a detective at a crime scene. You do not examine every clue. You look for the few that matter.
Part A: Finding the “what” with quantitative data
GA4 is your flashlight. It shows what is happening and where. The fastest way to find your biggest leak is a funnel exploration, which lets you “visualize the steps your users take to complete a task.” For a shop, the steps might be view product, add to cart, begin checkout and purchase.
Here is the example I use in the book. Say 1,000 people start a session, and 300 of them view a product: a 70% drop-off. Then 150 add to cart, and 75 complete the purchase. Most owners would start by fixing the checkout. But the biggest leak is the first step, where 70% leave without looking at a single product. That is your “metric on fire.”
Then ask three questions:
- Which page has the largest drop-off before the key event? That is your biggest leak.
- Which channel brings users who complete key events? That is where to invest. One example is an Indian maker of transmission towers that sells abroad. From March to August 2026, organic search brought 30% of its site’s sessions but 75% of its key events in GA4. My team at Adtric built that site and handles its SEO (case study). Looking at sessions alone would have hidden that.
- Which pages and searches bring people from Google? That tells you which content to expand. Search Console answers this one better than GA4, because it shows the actual queries.
Part B: Finding the “why” with qualitative data
Numbers show where visitors leave, not why. For that, you need to see your site through their eyes.
- Heatmaps lay clicks and scroll depth over your page. A common warning sign is a hot spot on something that isn’t a link, such as a phone icon or a product photo. People click, nothing happens, and they leave frustrated.
- Session recordings are the security camera footage: anonymized replays of real visits that show hesitation, confusion and the moment someone gives up. A few recordings can teach you more than hours of spreadsheets.
In the book, I describe a product page where the numbers looked fine but sales did not. Recordings showed visitors scrolling down to pick a color, then back up to see the image change, again and again. The color selector sat too far from the product photo. No spreadsheet would have shown that.
You can start for free. Microsoft Clarity describes itself as “Free forever” with “No limits on traffic,” and it offers both heatmaps and session recordings.
From Clues to a Testable Fix
Clues are not a plan. Turn the “what” and the “why” into a hypothesis. In the book, I use this structure:
“Based on [your qualitative insight], we believe that making [a specific change] will result in [a measurable improvement], because [the reason you believe it will work].”
For the color selector, it reads like this. Recordings show users scrolling back and forth between the color options and the product image. So we believe that moving the selector directly below the main image will raise the add-to-cart rate, because it removes that back-and-forth.
That is no longer a vague plan to “change the design”. It is one specific, measurable change. A hypothesis can still be wrong, so test it against the current page before you roll it out. I explain how in The HiPPO Problem.
Why This Matters: Data-Driven Companies Win
The payoff can be large. A 2014 McKinsey article, Five facts: How customer analytics boosts corporate performance, drew on a 2013 survey of 400 top managers at large international companies. It found that “intensive users of customer analytics are 23 times more likely to clearly outperform their competitors” in new-customer acquisition. They were also “nine times more likely to surpass them in customer loyalty.”
The same survey found that “the likelihood of achieving above-average profitability is almost 19 times higher” for these companies. It is a survey of large firms, so read it as a direction, not a promise. The logic still holds for a small business: the most profitable move is rarely more traffic. It is fixing the bucket you already have.
Stop Guessing, Start Growing
Most businesses look at their data only when sales drop. That is reactive. Refinement, the sixth principle of the C.O.N.V.E.R.T. Method, is about continuous improvement. Fix one leak that lifts sales by 10%, then another that adds 5%, and keep going.
So set up GA4 and Search Console this week, mark one key event and look at your funnel. For a structured first pass, work through the seven questions in my website conversion audit.
If you want help reading the data, my website conversion review uses GA4 to show where visitors drop off by page and device. It adds heatmaps and recordings where they are installed, and you get a prioritized list of changes, each with its reasoning.
