You poured your heart and soul into your website. It’s live, it looks great, but let’s ask the most important question: Do you know if it’s actually working?
Imagine running a retail store without ever checking the sales figures. You wouldn’t know what’s popular, which marketing drives foot traffic, or if you’re even making a profit. It’s a guaranteed path to failure.
Yet, countless businesses run their websites this way every single day. Their digital storefront, which they poured their heart into, feels less like a powerful growth engine and more like a beautiful, expensive, and incredibly leaky bucket.
They have no idea how many people visit, where they come from, or what they do. This is the dangerous pitfall of missing analytics and conversion tracking. You simply can’t improve what you don’t measure.
As a website strategist and full-stack SEO engineer, I’ve seen firsthand how this “blindfold of ignorance” cripples businesses. They’re pouring resources into their online presence with absolutely no idea if they’re getting any return.
Let’s not just talk about the problem. It’s time to stop guessing and start growing.
The High Cost of Flying Blind
Operating a website without analytics is like flying a plane blind. You might be moving, but you don’t know your altitude, your speed, or your direction. Without data, your website exists in a black box, leaving you guessing about critical performance metrics. This means you’re missing:
- Visitor Insights: Who your audience is, what problems they’re trying to solve, and what technology they use.
- Traffic Sources: You can’t tell if your SEO, social media, or paid ad efforts are bringing you valuable visitors or just empty clicks.
- User Behavior: Which pages are popular, and more importantly, which ones are acting as dead ends, causing people to leave your site for good.
- Content Performance: You’ll have no idea if that blog post you spent hours writing is actually resonating with your audience or just collecting digital dust.
Operating without this information isn’t just inefficient; it’s a direct path to wasted resources and missed opportunities. You end up pouring more and more money into traffic, trying to fill that leaky bucket faster than the money can drain out.
The Solution: A Mechanic’s Guide to Fixing the Leaks
Talking about “data” can feel intimidating, but getting started is easier than you think. Think of yourself not as a data scientist, but as a mechanic with a diagnostic toolkit. Here is your straightforward path to take the blindfold off and start plugging the holes.
Step 1: Install Your Dashboard (Google Analytics 4)
Before you can diagnose the engine, you need a control panel. For 99% of businesses, the answer is Google Analytics 4 (GA4). It’s the industry standard, it’s incredibly powerful, and it’s free.
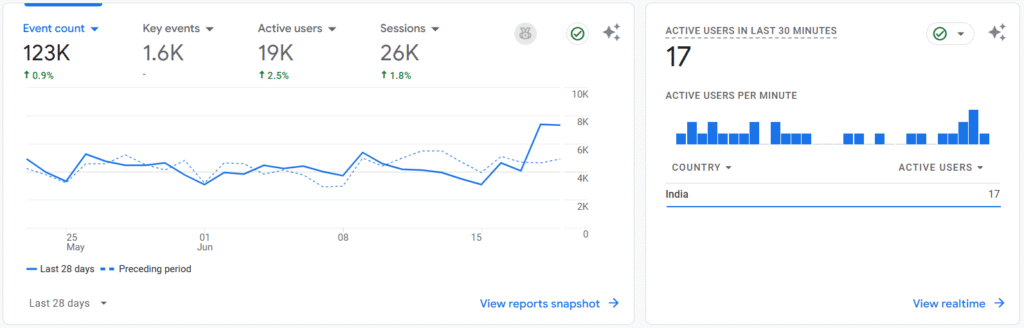
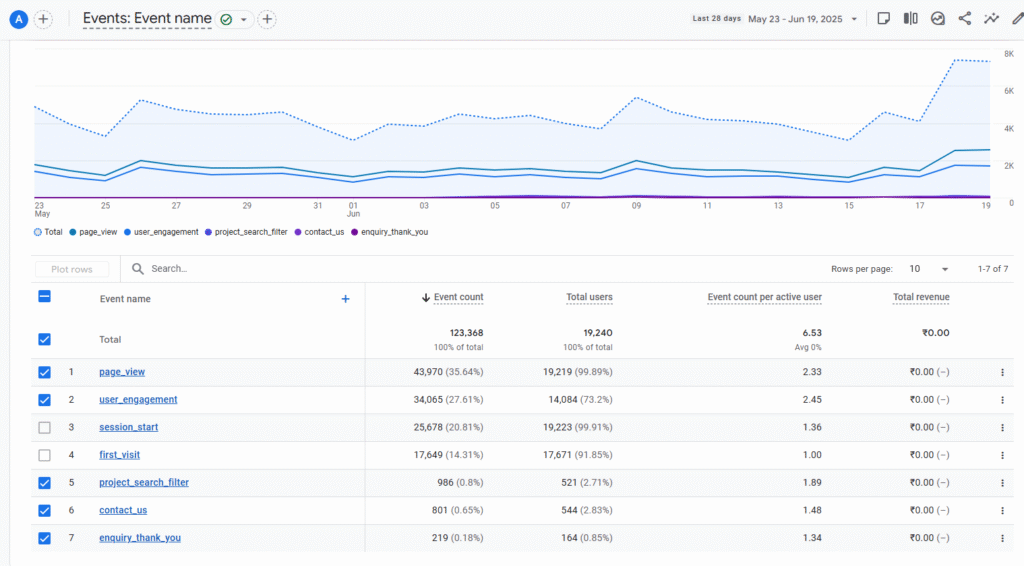
GA4 represents a major shift in how we measure website activity. Unlike its predecessor, which was based on “sessions,” GA4 is built around “events”. Every single user interaction—a page view, a button click, a video play, a purchase—is captured as a distinct event. This gives you a far more flexible and detailed view of the actual customer journey.
- How to do it: Go to the Google Analytics website, create a new account, and follow the instructions to get a small piece of code (a “tag”). This tag needs to be added to your website. If you use a platform like WordPress, Shopify, or Squarespace, there are simple plugins and integrations that let you do this just by copying and pasting your measurement ID—no complex coding required.
Step 2: Define Your Destination (Key Events)
Analytics tells you what happened. Conversion tracking tells you if what happened mattered. In GA4, these important actions—your “wins”—are designated as “Key Events”. These should be the one or two actions that directly move your business forward.
- How to do it: First, identify your primary business goals.
- For a service business: A Key Event is likely a
generate_leadorform_submitevent. - For an e-commerce store: The ultimate Key Event is a
purchase. - For a consultant: It might be a
file_downloadfor a guide or a newsletter sign-up.
- For a service business: A Key Event is likely a
Once you know your goals, you can simply toggle the switch for that event in your GA4 settings to mark it as a Key Event. Now, you can see exactly which traffic sources, campaigns, and pages are driving real business results.
Step 3: Become a Data Detective
Once data is flowing, your job is to be curious. As I explain in my book, Decoding The Click, we must approach our data like a detective arriving at a crime scene. You don’t need to analyze everything; you just need to know which clues matter.
Part A: Finding the “What” with Quantitative Data
Your GA4 account is your flashlight for finding clues. It tells you what is happening and where. One of the most powerful reports for this is the Funnel Exploration.
This tool lets you map out the exact steps a user must take to complete your Key Event (e.g., View Product > Add to Cart > Begin Checkout > Purchase). It then visually shows you how many users complete each step and, crucially, where they drop off. This is the fastest way to find the biggest leaks in your bucket.
Once you’ve identified a leak, ask targeted questions:
- “Which page has the biggest drop-off before users complete my Key Event?” (This is your biggest leak) .
- “Which marketing channel (e.g., Organic Search, Paid Social) is bringing in the users who actually complete my Key Events?” (This tells you where to invest your budget) .
- “What are the top pages people find through Google search?” (This shows you what content is resonating and what to create more of) .
Part B: Finding the “Why” with Qualitative Data
The numbers tell you where visitors are disappearing, but they can’t tell you why. To understand the motive, you need to switch from detective to psychologist and see the website through your users’ eyes. This is where qualitative tools come in:
- Heatmaps: These tools create a visual overlay on your site, showing you exactly where users are clicking and how far they scroll. You might discover users are furiously clicking on an image that isn’t a link—a clear sign of frustration.
- Session Recordings: This is the “security camera footage” of your website. You can watch anonymous recordings of real user visits to see exactly where they hesitate, get confused, or give up. Watching just a few of these videos can provide more actionable insights than hours spent staring at spreadsheets.
Looking at your data with these questions and tools transforms it from a confusing spreadsheet into an actionable roadmap for growth.
Why This Matters: Data-Driven Companies Win
This isn’t just a theoretical exercise. The impact is staggering. According to a landmark report by McKinsey, companies that use data to make decisions are:
- 23 times more likely to attract new customers.
- 6 times more likely to keep those customers.
- 19 times more likely to be profitable.
As I detail in my book, the most profitable lever you can pull in your business is to stop focusing on pouring more water (traffic) in and start fixing the bucket. This process of continuous optimization is the secret to building Websites That Stand Strong and turning an average site into a formidable competitive advantage.
Stop Guessing, Start Growing
As we move through, the importance of data is only growing. The landscape is shifting towards privacy-focused analytics and AI-driven predictions that make data easier to understand. Ignoring this trend means getting left behind.
Don’t let your website operate in the dark. Taking these simple steps to implement analytics and tracking will be the single most impactful decision you make for your online presence this year.
Ready to stop guessing and start growing? This is how you turn your website into a powerful, data-driven asset.